

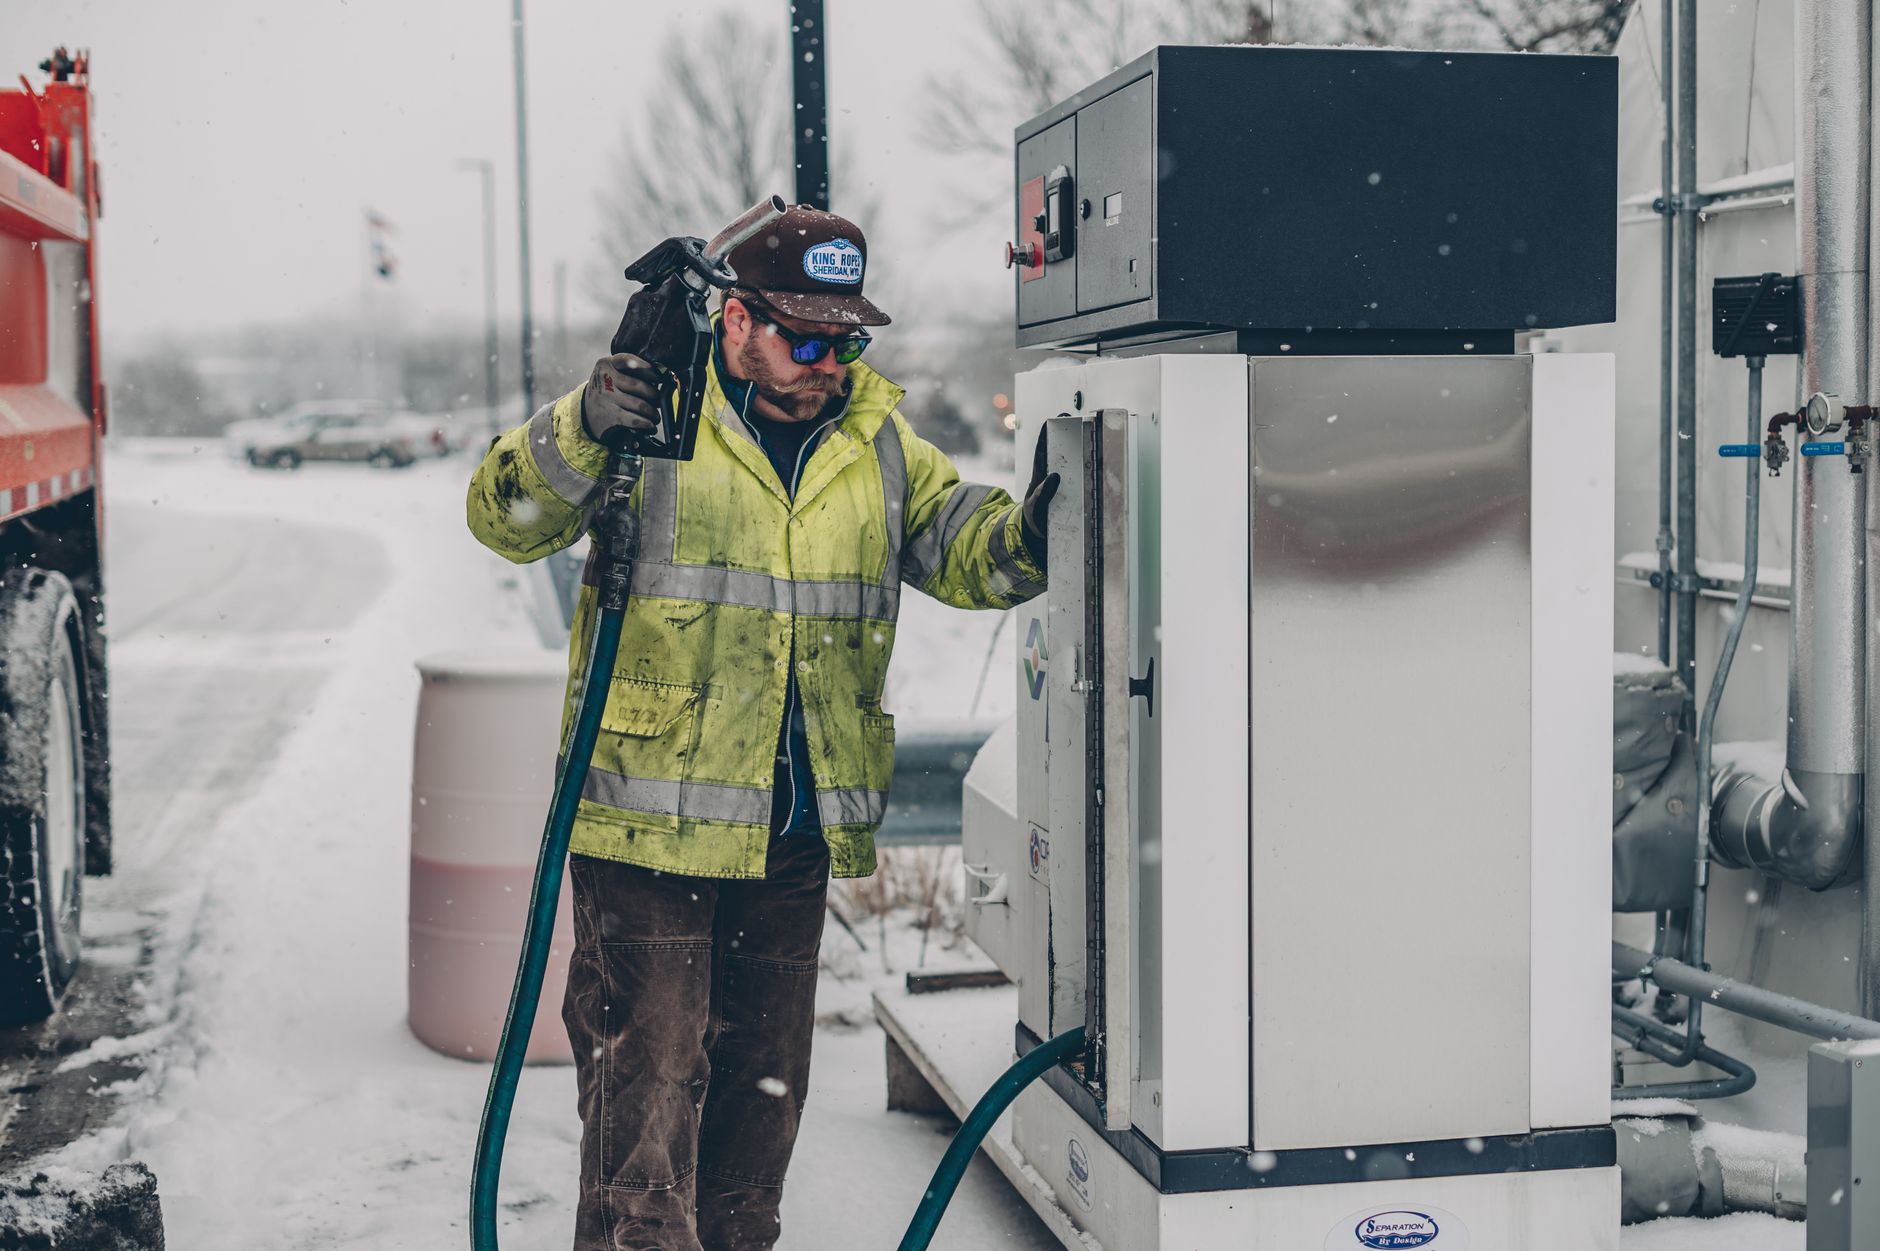
The diesel nozzle at a truck stop just outside Des Moines drips steady, dark fuel onto oil-stained concrete. On the pump screen, the numbers spin with relentless speed: 180 gallons, $1,080.00. Inside the cab, the driver stares at a spot market rate confirmation sheet for a refrigerated load bound for Ohio. The gross pay is $3,200 across an 800-mile run. Two months ago, that rate delivered a comfortable operating margin. Today, after subtracting $1,080 in fuel, $300 in truck and trailer financing, $180 in insurance allocation, tolls, tires, and maintenance reserves, the net margin has compressed into thin air.
This scenario plays out daily across American interstate corridors. When diesel prices surge from a historical baseline of $3.47 to $6.06 or higher per gallon, the financial foundation of independent trucking shifts instantly. For high-volume mega-fleets, fuel shocks are buffered by massive enterprise volume discounts, direct fuel surcharge pass-through contracts, and hedging strategies. For independent owner-operators and small fleets, a sustained surge to $6.00 diesel represents an immediate existential crisis.
Surviving this environment requires moving beyond hope and anger at pump prices. It demands treating your truck not merely as a vehicle, but as a mobile industrial unit where every mechanical variable, driver decision, and route choice directly expands or contracts net cash flow.
The Fuel Cost Squeeze At $6.00/Gal
- BASELINE NON-FUEL COST: $1.854 / mile (ATRI Benchmark)
- AT 6.5 MPG: Fuel CPM = $0.923 ---> TOTAL COST PER MILE: $2.777
- AT 8.0 MPG: Fuel CPM = $0.750 ---> TOTAL COST PER MILE: $2.604
- ANNUAL PROFIT DELTA (130,000 MILES): $22,490 SAVED
How to Maintain Profitability During a $6 Diesel Price Shock
Owner-operators survive $6 diesel by reducing highway speeds to 62–65 mph, eliminating overnight idling with auxiliary power units, negotiating baseline fuel surcharges into spot contracts, and upgrading fuel efficiency from 6.5 to 8.0 MPG. This per-mile cost reduction saves over $22,000 annually across 130,000 miles, directly offsetting linehaul rate compression.
Recalibrating Your Cost Per Mile (CPM) for High-Diesel Environments
Most independent carriers operate using outdated cost-per-mile (CPM) calculations established when fuel was $3.50 per gallon. Operating without a precise, real-time cost model during a fuel spike is the fastest route to insolvency.
According to data from the American Transportation Research Institute (ATRI), the average total operating cost for Class 8 freight carriers reached an all-time high of $2.336 per mile. Baseline non-fuel operating costs—including equipment finance payments, driver compensation, insurance, repair and maintenance, permits, and tires—average roughly $1.854 per mile.
When diesel hits $6.00 per gallon, fuel cost per mile becomes the single most volatile variable in your operating statement. The math is stark:
Fuel Cost Per Mile (CPM) = \frac{Price Per Gallon{Miles Per Gallon (MPG)
At $6.00 per gallon and a baseline efficiency of 6.5 MPG, your fuel CPM is $0.923. Adding this to the baseline non-fuel cost of $1.854 per mile yields a total operating breakeven cost of $2.777 per mile. If the spot market rate for a lane drops to $2.50 per mile, every loaded mile driven represents a net financial loss of $0.277, before accounting for deadhead miles.
Fuel Cost Per Mile Matrices At $6.00 Diesel
| Fuel Economy (MPG) | Fuel CPM ($6.00/gal) |
|---|
| 5.5 MPG (Poor) | $1.091 / mile |
|---|---|
| 6.0 MPG (Below Average) | $1.000 / mile |
| 6.5 MPG (Industry Baseline) | $0.923 / mile |
| 7.0 MPG (Average Optimization) | $0.857 / mile |
| 7.5 MPG (High Optimization) | $0.800 / mile |
| 8.0 MPG (Elite Optimization) | $0.750 / mile |
Improving fuel economy from 6.5 MPG to 8.0 MPG drops your fuel CPM from $0.923 to $0.750—a direct reduction of $0.173 per mile. Across a standard annual run of 130,000 miles, that shift saves $22,490 in raw cash outlay.
Annual Fuel Expenditure Comparison (130,000 Miles/Year)
| $6.00 Diesel at 6.5 MPG ====================================> $119,990 |
|---|
| $6.00 Diesel at 8.0 MPG =============================> $97,500 |
| DIRECT CASH SAVINGS: [ $22,490 PROFIT PRESERVATION ] |
Gaining 1.5 MPG is not an academic exercise; it is the financial equivalent of securing a $0.17/mile linehaul rate increase across every mile driven, without negotiating with a single broker.
The Working Capital Trap
A critical threat during rapid fuel spikes is working capital strain. Trucking operates on cash upfront and revenue later. When diesel hits $6.00, an owner-operator running 10,000 miles a month spends roughly $9,230 on fuel up front. However, brokers and shippers often take 30 to 60 days to settle invoices.
This cash lag creates a severe working capital gap. A driver can remain technically profitable on paper while going bankrupt in practice simply because cash reserves are fully drained by pump outlays weeks before receivable invoices clear. Managing this risk requires maintaining a dedicated liquid fuel reserve equal to at least 45 days of operational fuel costs ($12,000 to $15,000 per truck) or utilizing non-recourse factoring with direct same-day fuel card advances—accepting a 1.5% to 3% fee as an insurance policy against operational cash flow paralysis.
Driving Mechanics: Speed, Aerodynamics, and Coasting
Vehicle configuration and driving style account for up to 30% of a Class 8 truck’s total fuel consumption. When fuel is cheap, drivers trade fuel efficiency for time by running 70+ mph. At $6.00 per gallon, that exchange becomes economically unviable.
The Physics of Speed and Fuel Burn
Aerodynamic drag does not scale linearly; it scales exponentially with speed. Overcoming air resistance requires roughly twice as much horsepower at 70 mph as it does at 50 mph. For a standard Class 8 tractor-trailer, every single mile per hour driven over 65 mph reduces overall fuel economy by approximately 0.1 MPG.
Speed Vs. Mpg Penalty Trajectory
| Speed (MPH) | Average MPG | Fuel CPM ($6.00/gal) | Cost Penalty per 1,000 Miles |
|---|
| 62 mph | 7.8 MPG | $0.769 | Baseline |
|---|---|---|---|
| 65 mph | 7.5 MPG | $0.800 | + $31.00 |
| 68 mph | 7.2 MPG | $0.833 | + $64.00 |
| 70 mph | 6.8 MPG | $0.882 | + $113.00 |
| 75 mph | 6.0 MPG | $1.000 | + $231.00 |
Consider a 1,000-mile haul:
- Driving at 75 mph takes 13.3 hours driving time, burning 166.6 gallons ($1,000 fuel cost).
- Driving at 63 mph takes 15.8 hours driving time, burning 129.8 gallons ($779 fuel cost).
By slowing down, you trade 2.5 hours of driving time for $221 in cash savings. That yields an effective tax-free return of $88.40 per hour for those extra 2.5 hours.
| THE SPEED VS. TIME VS. COST TRADEOFF (1,000-MILE TRIP) |
|---|
- 75 MPH: [ 13.3 Hours Driving Time ] ---> Fuel Spend: $1,000
- 63 MPH: [ 15.8 Hours Driving Time ] ---> Fuel Spend: $779
- EFFECTIVE EARNINGS: $221 Saved for 2.5 Hours = $88.40/Hour Tax-Free
Navigating the Hours-of-Service (HOS) Trade-Off
Slowing down carries a real constraint: Federal Motor Carrier Safety Administration (FMCSA) Hours-of-Service regulations. Dropping speed from 70 mph to 62 mph reduces daily coverage under an 11-hour drive window from ~700 miles to ~620 miles.
On tight delivery windows, losing 80 miles a day can force an overnight rest stop before final delivery, potentially missing a appointment window or losing a follow-on load.
The strategy must fit the route:
- Tight, appointment-critical loads: Run at optimal flow speed (65 mph) to secure delivery without triggering HOS violations or detention penalties.
- Flexible long-haul or backhaul runs: Reduce speed to 62 mph. The $0.10+ per mile saved in fuel outweighs the theoretical value of reaching a staging area early to sit unpaid waiting for a dock door.
Progressive Shifting and Predictive Coasting
Modern diesel platforms (such as the Detroit DD15 or Cummins X15 paired with automated manual transmissions like the Eaton Endurant or Detroit DT12) deliver peak torque at low RPM ranges (typically 900 to 1,200 RPM).
- Avoid Over-Revving: Keep engine speeds below 1,300 RPM during acceleration. Progressive shifting uses low engine speeds in lower gears, accelerating smoothly without flooring the pedal.
- Predictive Coasting: Anticipate traffic light changes, off-ramps, and rolling terrain. Taking your foot off the accelerator early lets engine braking and vehicle momentum do the work. When descending a grade, allow the kinetic momentum of the vehicle to build within safe limits rather than fueling down the hill and braking hard at the bottom.
- Maintain Buffer Distance: Maintaining a 6-to-8 second follow distance prevents constant braking and acceleration adjustments caused by four-wheelers cutting in front. Every time you touch the brake pedal, you waste kinetic energy paid for at $6.00 a gallon.
Low-Cost Aerodynamic and Tire Modifications
If capital is limited, focus on high-ROI aerodynamic adjustments and tire maintenance rather than expensive overhauls.
Aerodynamic & Mechanical Fuel Efficiency Upgrades
| Upgrade / Modification | Estimated Cost | Fuel Efficiency Gain (MPG) |
|---|
| Drive & Steer Tire Inflation | $0 (Maintenance) | + 0.1 to 0.3 MPG |
|---|---|---|
| Trailer Gap Reduction (18") | $200 - $500 | + 0.1 to 0.2 MPG |
| Low-Rolling Resistance Tires | $3,500 - $5,000 | + 0.2 to 0.4 MPG |
| Side Skirts / Flow Below | $1,200 - $2,500 | + 0.3 to 0.5 MPG |
| Wheel Covers & Deflectors | $300 - $800 | + 0.1 to 0.2 MPG |
- Tire Pressure Calibration: Running tires just 10 PSI under recommended inflation increases rolling resistance and reduces fuel economy by roughly 1%. Check tire pressure cold before every trip using a calibrated digital gauge.
- Trailer Gap Reduction: A wide gap between tractor cab and trailer allows crosswinds to swirl, creating massive aerodynamic drag. Set your fifth wheel slide position as far forward as safe steer-axle weight limits allow, targeting a gap of 18 to 24 inches between the cab extenders and front trailer wall.
- Cab Extenders and Wheel Covers: Smooth side fairings and wheel covers cost under $800 combined and eliminate drag pockets around the drive axles, yielding up to a 1.5% efficiency boost.
The Zero-Idle Operation: Eliminating the $48 Nightly Cash Drain
An idling Class 8 diesel engine burns approximately 0.8 to 1.2 gallons of fuel per hour operating at standard idle RPM (600–800 RPM) to run cab HVAC and keep engine fluids warm. At $6.00 per gallon, idling is an unnecessary cash drain.
The Mathematics Of Overnight Idling
| Hourly Idle Burn Rate: 1.0 Gallon / Hour |
|---|
| Fuel Cost: $6.00 / Gallon |
| Nightly Rest Period: 8 Hours |
| DAILY IDLE COST: $48.00 per night |
|---|
| MONTHLY IDLE COST: $1,440.00 per month (30 days) |
| ANNUAL IDLE COST: $14,400.00 per year (300 rest days) |
Idling also dilutes engine oil with unburnt fuel, accelerates soot buildup in the Diesel Particulate Filter (DPF), and increases Exhaust Gas Recirculation (EGR) valve fouling. Engine wear from idling adds an estimated $0.02 to $0.04 per mile in accelerated maintenance costs.
Idle Reduction Solutions: Capex Vs. Opex Analysis
| Solution System | Capital Cost | Operating Cost/Hr | ROI Payback Period |
|---|
| Diesel APU (RigMaster) | $9,000-$13,000 | $1.20 (0.2 gal/hr) | 8 to 11 Months |
|---|---|---|---|
| Battery APU (e-APU) | $7,000-$10,000 | $0.15 (Grid charge) | 6 to 9 Months |
| Diesel Bunk Heater | $1,200-$1,800 | $0.30 (0.05 gal/hr) | 1.5 to 3 Months |
| Shore Power System | $500-$1,200 | $0.20-$0.50 (Grid) | Under 1 Month |
Strategic Idle Alternatives
Diesel Auxiliary Power Units (APUs)
A diesel APU burns roughly 0.2 gallons per hour while delivering full air conditioning, heating, and 120V electrical power.
- Nightly fuel burn: $1.20/hour × 8 hours = $9.60/night.
- Net savings vs. main engine idle: $38.40 per night.
- ROI Calculation: At $38.40 daily savings across 25 days/month, a $10,000 installed APU breaks even in under 11 months of operation.
Compact Diesel Bunk Heaters (Eberspächer / Webasto)
If an APU is outside your current cash budget, install a dedicated diesel bunk heater immediately. These compact units heat the sleeper berth using only 0.05 gallons of fuel per hour.
- Nightly heating burn: 0.4 gallons ($2.40 per night) compared to main engine idling at $48.00 per night.
- Costing between $1,200 and $1,800 installed, a bunk heater pays for itself in less than 40 winter rest nights.
Battery-Powered Climate Control & Shore Power
Lithium-ion battery e-APU systems provide 8 to 10 hours of cooling without burning fuel. Pair this with shore power shore-plug connectivity (e.g., IdleAir or cab-park electric pedestals at major travel plazas), which provides grid electricity for $1.50 to $2.50 per hour.
Overnight Hvac Cost Per Night Comparison
| Main Engine Idle ($6.00/gal): [ $48.00 ] |
|---|
| Diesel APU (0.2 gal/hr): [ $9.60 ] |
| Shore Power Plug-in: [ $3.00 ] |
| Diesel Bunk Heater (Heat Only):[ $2.40 ] |
Spot Market Load Negotiation & Surcharge Capture
Contract carriers utilize contractual Fuel Surcharges (FSC) indexed directly to the Department of Energy (DOE) national diesel price index. When fuel rises, the FSC automatically increases, shielding the carrier.
For independent owner-operators working the spot market through digital load boards, no such automatic safety net exists.
The Spot Market Fuel Surcharge Illusion
| BROKER QUOTE (Gross Flat Rate): $3,000 for 1,000 miles |
|---|
| ILLUSION: |
| Driver assumes $3.00/mile linehaul. |
| REALITY AT $6.00 DIESEL (DOE Baseline $1.25, 6.0 MPG Base): |
| Calculated FSC Component: ($6.00 - $1.25) / 6.0 MPG = $0.792 / mile |
| True Linehaul Component: $3.00 - $0.792 = $2.208 / mile |
| WARNING: Spot rates often compress base linehaul to mask high overall costs. |
Decoding Spot Market Surcharge Structures
In the spot market, brokers frequently quote "flat rates" (e.g., $3,000 for 1,000 miles). They may claim a fuel surcharge is included, but without line-item transparency, brokers often compress the underlying linehaul rate to offset the fuel surge, shifting cost burdens onto the carrier.
To protect operating margins, calculate the true fuel surcharge component on every spot load quote using the standard industry formula:
Fuel Surcharge Per Mile = \frac{Current DOE Diesel Price - Baseline Diesel Price{Agreed Baseline MPG
Standard industry baselines use a $1.25 per gallon base rate and 6.0 MPG benchmark efficiency.
- Current Diesel Price: $6.00/gal
- Baseline Difference: $6.00 - $1.25 = $4.75
- Formula: $\frac{\$4.75}{6.0 MPG} = \mathbf{\$0.791 per mile FSC}$
If a broker offers a 1,000-mile load for $3,000 gross flat ($3.00/mile), subtract the $0.791/mile fuel surcharge. The true linehaul rate is actually $2.209 per mile.
If your non-fuel baseline operating cost is $1.854/mile, your net margin before taxes and driver pay is reduced to just $0.355 per mile.
Spot Rate Deconstruction & Margin Calculator
| Gross Spot Rate Quote (1,000 Miles) | $3,000.00 ($3.00/mi) |
|---|---|
| Less Calculated Fuel Surcharge ($0.791/mi) | - $791.00 |
| TRUE BASE LINEHAUL REVENUE | $2,209.00 ($2.209/mi) |
|---|---|
| Less Baseline Non-Fuel Operating Cost ($1.854/mi) | - $1,854.00 |
| NET PROFIT CONTRIBTUION (Pre-Tax) | $355.00 ($0.355/mi) |
|---|
Real-Time Negotiation Strategy
- Demand Itemized Rate Confirmations: Require the broker to split the linehaul rate and fuel surcharge into distinct line items on the rate confirmation agreement.
- Anchor to Benchmarks: Reference real-time spot market indices like the DAT Freight Analytics index or the SONAR National Truckload Index (NTI). When spot rates hover around $2.35–$2.50 per mile during fuel price spikes, refuse flat rates that yield an effective linehaul below your non-fuel CPM ($1.854).
- Minimize Deadhead Miles: Unloaded miles consume fuel without generating revenue. At $6.00 diesel and 7.5 MPG unloaded efficiency, deadheading costs $0.80 per mile in fuel alone. Never move your truck more than 50 miles without a paying load unless moving out of an unprofitable market.
- Account for Out-of-Route Penalties: Off-route detours driven for cheap pump prices can cost more than they save. A 30-mile out-of-route detour burns roughly 4.6 gallons ($27.60 at $6.00/gal), plus wear and tear. If the fuel savings at the discount station is only $0.15/gal across 150 gallons ($22.50 total savings), taking the detour results in a net loss of $5.10.
Out-Of-Route Fuel Detour Cost Calculator
| DETOUR DISTANCE: 30 Extra Miles Out-of-Route |
|---|
| FUEL CONSUMED (6.5 MPG): 4.61 Gallons |
| DETOUR FUEL COST: 4.61 gal x $6.00/gal = $27.66 |
| WEAR & TEAR ALLOCATION: 30 miles x $0.20/mile = $6.00 |
| TOTAL DETOUR COST: $33.66 |
|---|
| PUMP SAVINGS AT DETOUR: 150 Gallons x $0.15/gal Discount = $22.50 |
| NET LOSS FROM DETOUR: -$11.16 [ BAD OPERATIONAL DECISION ] |
|---|
Tactical Execution Matrix: 90-Day Operational Plan
To survive a high-cost environment, implement operational changes systematically. Use this 90-day matrix to reduce risk and stabilize cash flow.
90-Day Operational Execution Matrix
| PHASE | ACTION ITEMS & TARGET MILESTONES |
|---|
| DAYS 1–30 | 1. Recalibrate per-mile breakeven using $6.00 fuel CPM math. |
|---|---|
| Immediate | 2. Set ECM engine governor or cruise limit to 63-65 mph. |
| Cash Defense | 3. Establish strict zero-idle rule; install diesel bunk heater. |
| 4. Audit tire pressure cold weekly; calibrate to 105–110 PSI. | |
| 5. Join bulk fuel discount networks (Mudflap, TCS, TA Select). |
| DAYS 31–60 | 1. Mandate itemized fuel surcharges on all spot load contracts. |
|---|---|
| Asset & Route | 2. Tighten tractor-trailer gap to 18-24 inches. |
| Optimization | 3. Caps maximum deadhead distance to <= 5% of total trip miles. |
| 4. Audit routes using fuel optimization apps to bypass high-tax | |
| jurisdictions while managing IFTA reporting balances. |
| DAYS 61–90 | 1. Evaluate APU installation ROI; secure equipment financing. |
|---|---|
| Capital | 2. Retrofit drive axles with low-rolling-resistance tires. |
| Resilience | 3. Build a liquid fuel reserve equal to 45 operational days. |
| 4. Establish direct relationships with regional shippers to | |
| transition off spot boards onto index-backed contracts. |
Operational Scenarios: High-Efficiency vs. Unoptimized Fleets
To illustrate how operational decisions compound, let's compare two owner-operators running identical 10,000-mile monthly schedules with $6.00 per gallon diesel.
Operational Profile Comparison ($6.00 Diesel)
| Operational Variable | Carrier A | Carrier B |
|---|---|---|
| (Unoptimized) | (High Efficiency) |
| Cruising Highway Speed | 72 mph | 63 mph |
|---|---|---|
| Average Fuel Economy | 5.8 MPG | 8.0 MPG |
| Nightly Idling (30 Rest Periods) | 8 Hours/Night | Zero (APU System) |
| Monthly Deadhead Percentage | 12% (1,200 mi) | 4% (400 mi) |
| Fuel Card Discount Average | $0.10 / gallon | $0.45 / gallon |
| MONTHLY FUEL CONSUMPTION (Driving) | 1,724 Gallons | 1,250 Gallons |
|---|---|---|
| MONTHLY FUEL CONSUMPTION (Idling) | 240 Gallons | 15 Gallons (APU) |
| TOTAL MONTHLY FUEL GALLONS | 1,964 Gallons | 1,265 Gallons |
| AVERAGE NET PUMP PRICE | $5.90 / gallon | $5.55 / gallon |
| TOTAL MONTHLY FUEL EXPENDITURE | $11,587.60 | $7,020.75 |
|---|
| NET DIRECT MONTHLY DIFFERENCE | CARRIER B SAVES: $4,566.85 / MONTH |
|---|---|
| NET ANNUALIZED DIFFERENCE | CARRIER B SAVES: $54,802.20 / YEAR |
Carrier A suffers severe margin compression and risks insolvency within months. Carrier B, running the exact same mileage in the exact same market, retains $4,566.85 more in cold cash every single month. Efficiency, speed management, idle elimination, and discount networks directly determine who survives market volatility.
Navigating Trade-Offs, Constraints, and Market Realities
While the mathematical case for fuel optimization is absolute, applying these strategies requires balancing real-world tradeoffs:
1. Speed Reduction vs. Shipper Service-Level Agreements (SLAs)
Slowing to 62 mph reduces daily mileage capability. On time-critical freight (such as fresh produce, meat, or automotive line-feed parts), missing a dock window can trigger detention penalties ($50–$100/hour), late-delivery fee claims, or complete loss of the customer relationship.
*The Operational Compromise:* Apply maximum speed limits (62–63 mph) exclusively on flexible freight and longer transit lanes. On time-sensitive loads, calculate the exact speed required to clear the route safely within HOS limits and maintain required arrival cushions.
2. Capital Investment vs. Cash Reserves
Deploying $10,000 to $13,000 for a diesel APU or $4,000 for high-tier low-rolling-resistance tires can be difficult during cash flow squeezes.
*The Operational Compromise:* Avoid taking on high-interest credit card debt to finance equipment during market downturns. Instead, implement zero-cost operational fixes first (reducing speed, adjusting fifth-wheel placement, eliminating non-essential idling). Reinvest initial monthly fuel savings into lower-cost equipment upgrades—like a $1,500 bunk heater—before committing to large capex expenditures like full APUs or complete tire retrofits.
Capital Allocation Staging Roadmap
| STAGE 1: ZERO-CAPEX FIXES (Day 1) | ||
|---|---|---|
| - Drop speed to 63 mph | Adjust Fifth Wheel | Audit Cold Tire Pressure |
| -> Yields immediate 0.8 - 1.2 MPG gain |
| STAGE 2: LOW-CAPEX RETROFITS (Month 1-2) | |
|---|---|
| - Install Bunk Heater ($1,500) | Add Wheel Covers ($400) |
| -> Reinvest saved fuel dollars from Stage 1 |
| STAGE 3: HIGH-CAPEX ASSET UPGRADES (Month 6+) | |
|---|---|
| - Full Diesel APU ($11,000) | Low-Rolling-Resistance Tire Sets |
| -> Fully funded by accumulated fuel efficiency cash surpluses |
3. Fuel Card Discounts vs. Network Routing Restraints
Major fuel cards offer deep discounts ($0.40–$0.70 off retail) at large truck stop chains, but these prices may still exceed small regional stop rates or require out-of-route travel.
*The Operational Compromise:* Use real-time fuel mapping applications (like Fuelbook or Mudflap) to check net prices (retail price minus discount plus state fuel tax) along your planned route. Focus on the net cost after taxes, rather than gross discounts, to prevent out-of-route mileage penalties from offsetting pump savings.
The Long Game: Turning Volatility into Market Advantage
Fuel spikes cause panic across the freight ecosystem, but they also serve as a stark operational reset. High-cost, inefficient fleets that rely on low diesel prices to subsidize wasteful habits quickly run out of capital when fuel spikes.
As unoptimized capacity exits the market, total active truck count contracts. When freight volumes stabilize, reduced truck supply helps rebuild linehaul pricing power for the carriers that remain.
The carriers that navigate $6.00 diesel successfully treat fuel optimization not as a temporary emergency measure, but as a permanent operational standard. When diesel inevitably returns to lower historical averages, a driver who trained their operation to thrive on 8.0 MPG at $6.00 fuel retains an extra $0.15 to $0.20 per mile in pure net margin.
In freight transportation, you cannot control global crude oil markets, geopolitical disruptions, or broker pricing. However, you retain complete control over your speed, idling time, maintenance standards, and route planning. Managing those variables disciplines your operating costs, protects your bank balance, and keeps your wheels turning while others park their trucks.
Key Takeaways
- Calculate Fuel Cost Per Mile Continuously: At $6.00 diesel, an efficiency change from 6.5 to 8.0 MPG saves $0.173 per mile—yielding $22,490 in annual profit preservation over 130,000 miles.
- Speed Controls Profitability: Every single mph driven over 65 mph penalizes fuel efficiency by roughly 0.1 MPG. Reducing speed from 75 mph to 63 mph yields an effective tax-free return of $88.40 per hour in saved fuel costs.
- Eliminate Main Engine Idling: Idling a Class 8 engine burns 1.0 gallon per hour ($48 per night at $6.00 diesel). Installing a diesel bunk heater or auxiliary power unit (APU) pays for itself in 3 to 11 months.
- Deconstruct Spot Rates: Always calculate the true linehaul rate by stripping out fuel surcharges calculated with the standard formula ($\frac{Current Price - \$1.25}{6.0}$). Never accept flat rates that disguise compressed linehaul revenue.
- Stage Capital Allocations: Start with zero-cost fixes (speed limits, tire pressure monitoring, fifth-wheel position) before reinvesting the realized cash savings into higher-cost equipment retrofits like APUs and low-rolling-resistance tires.


